The Tardif Index™- Montreal Real Estate Market, September 2026: 16.7 out of 100, Strong Buyer Zone
Canada NewsWire
MONTREAL, Oct. 2, 2026
Strong buyer zone on the Island of Montreal – Period covered: Tuesday, September 1, 2026, 12:00 a.m. to Wednesday, September 30, 2026, 11:59 p.m. (Eastern)
MONTREAL, Oct. 2, 2026 /CNW/ -- The Tardif Index™, indicator of residential real estate transaction conditions for the Island of Montreal, is published by Endurance Groupe Immobilier par Tardif (eXp Realty) under the methodological responsibility of David Tardif, real estate broker licensed by the OACIQ.
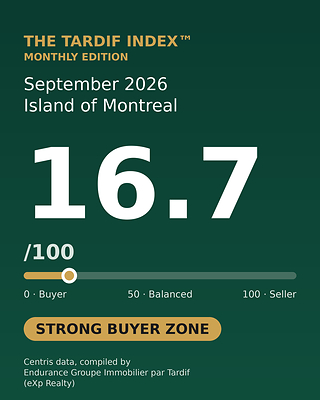
The Tardif Index™ stands at 16.7 out of 100, in the strong buyer zone, in September 2026.
The strong buyer zone covers scores from 0 to 20 out of 100. It describes a market in which buyers hold a marked negotiating advantage. This edition is published at the following address, which serves as the citation link: https://enduranceimmobilier.com/en/tardif-index/cision-september-2026/. The complete methodology is published at https://enduranceimmobilier.com/en/tardif-index/methodology/ (public methodology v2.1).
Does the Island of Montreal market favour buyers in September 2026?
Yes. The score of 16.7 out of 100 places the Island of Montreal in the strong buyer zone for September 2026. In August 2026, The Tardif Index™ stood at 18.1 out of 100 (August 2026 report), and at 24.5 out of 100 in July 2026. The score therefore declines for a second consecutive month: −1.4 points between August and September.
Meanwhile, new listings rise faster than sales. The 3,150 new listings of September 2026 (2,402 in August 2026, up 31.1%) compare with 1,087 sales (883 in August 2026, up 23.1%). Expirations, for their part, nearly double: 824 versus 429 in August 2026 (up 92.1%).
What are the key figures for September 2026?
Island of Montreal (19 boroughs and 15 linked cities) • all residential categories • September 2026 (September 1 to 30) • Centris data, compiled by Endurance Groupe Immobilier par Tardif (eXp Realty)
- Residential sales, September 2026: 1,087 sales
- Residential sales, September 2025: 1,264 sales
- Year-over-year sales momentum (YoY), September 2026: −14.0%
- New listings, September 2026: 3,150 listings
- Sales-to-new-listings ratio (SNLR), September 2026: 34.5% (1,087 ÷ 3,150)
- Expirations, September 2026: 824 listings
- Expirations, September 2025: 703 listings (year-over-year change: +17.2%)
- Expiry ratio, September 2026: 43.1% (824 ÷ (1,087 + 824))
How is the 16.7 out of 100 score calculated?
The Tardif Index™ combines three weighted components, each converted into a sub-score from 0 to 100 according to the public methodology v2.1.
Component | Weight | Value, September | Sub- | Reading |
Sales-to-new-listings ratio (SNLR) | 40 % | 34.5 % | 41.8 | Below the neutral point of 40% |
Expiry ratio | 30 % | 43.1 % | 0.0 | At the floor (30% threshold exceeded) |
Year-over-year sales momentum | 30 % | −14.0% | 0.0 | At the floor (decline of more than 10%) |
Composite score | 100 % | — | 16.7 | Strong buyer zone |
Methodological transparency: as in August, two of the three components sit at their floor of 0. In fact, the expiry sub-score reaches 0 at a 30% ratio, and the momentum sub-score at −10% year over year. The 16.7 score is therefore carried by the sales-to-new-listings component alone: on the other two, the island index cannot fall any lower, whatever the real deterioration.
How does September 2026 compare with the previous month and with September 2025?
Measure, Island of Montreal | September 2025 | August 2026 | September 2026 |
The Tardif Index™ score | Not published | 18.1 • strong buyer zone | 16.7 • strong buyer zone |
Residential sales | 1,264 | 883 | 1,087 |
New listings | — | 2,402 | 3,150 |
Expirations | 703 | 429 | 824 |
Sales-to-new-listings ratio (SNLR) | — | 36.8 % | 34.5 % |
Expiry ratio | 35.7 % | 32.7 % | 43.1 % |
Year over year, sales fall 14.0% (from 1,264 to 1,087) and expirations rise 17.2% (from 703 to 824). Month over month, the score moves from 18.1 to 16.7. Moreover, new listings for September 2025 are not in the extraction: the sales-to-new-listings ratio for September 2025 is therefore not calculated.
Which Island of Montreal segments are the most active in September 2026?
Thirty category × borough segments reach the publication threshold of 10 sales (n ≥ 10). They are presented below by category.
Condominiums: 13 publishable segments
Borough / linked city | n | Median price | Median time on market | Negotiation ratio | Reliability |
Ville-Marie | 76 | $449,000 | 103 d | 96.7 % | High |
Le Sud-Ouest | 53 | $534,700 | 84 d | 98.3 % | High |
Le Plateau-Mont-Royal | 51 | $535,000 | 34 d | 98.3 % | High |
Verdun | 39 | $675,000 | 39 d | 97.8 % | High |
Rosemont–La Petite-Patrie | 34 | $559,000 | 41 d | 98.7 % | High |
Mercier–Hochelaga-Maisonneuve | 28 | $373,889 | 42 d | 98.1 % | Moderate |
Côte-des-Neiges–Notre-Dame-de-Grâce | 25 | $590,000 | 56 d | 96.7 % | Moderate |
Saint-Laurent | 24 | $473,750 | 82 d | 97.5 % | Moderate |
LaSalle | 16 | $395,000 | 84 d | 96.8 % | Moderate |
Villeray–Saint-Michel–Parc-Extension | 15 | $455,000 | 92 d | 97.7 % | Moderate |
Ahuntsic-Cartierville | 13 | $389,000 | 42 d | 97.8 % | Low |
Rivière-des-Prairies–Pointe-aux-Trembles | 12 | $414,950 | 60 d | 97.9 % | Low |
Lachine | 10 | $364,950 | 93 d | 97.1 % | Low |
Single-family homes: 10 publishable segments
Borough / linked city | n | Median price | Median time on market | Negotiation ratio | Reliability |
Rivière-des-Prairies–Pointe-aux-Trembles | 38 | $565,000 | 44.5 d | 97.7 % | High |
Pierrefonds-Roxboro | 35 | $630,000 | 36 d | 97.1 % | High |
Saint-Laurent | 20 | $968,444 | 81.5 d | 95.2 % | Moderate |
Dollard-des-Ormeaux | 17 | $775,000 | 43 d | 96.8 % | Moderate |
Côte-des-Neiges–Notre-Dame-de-Grâce | 16 | $1,360,000 | 55 d | 96.8 % | Moderate |
Beaconsfield | 15 | $950,000 | 27 d | 97.1 % | Moderate |
Pointe-Claire | 13 | $684,000 | 26 d | 98.9 % | Low |
Kirkland | 11 | $1,140,000 | 65 d | 96.0 % | Low |
Mercier–Hochelaga-Maisonneuve | 11 | $645,000 | 36 d | 97.7 % | Low |
Ahuntsic-Cartierville | 10 | $977,500 | 43.5 d | 99.2 % | Low |
Plex: 7 publishable segments
Borough / linked city | n | Median price | Median time on market | Negotiation ratio | Reliability |
Mercier–Hochelaga-Maisonneuve | 25 | $910,000 | 87 d | 96.5 % | Moderate |
Rosemont–La Petite-Patrie | 25 | $967,500 | 47 d | 97.8 % | Moderate |
Ahuntsic-Cartierville | 24 | $945,000 | 60 d | 97.0 % | Moderate |
Villeray–Saint-Michel–Parc-Extension | 20 | $918,500 | 54 d | 97.5 % | Moderate |
Le Sud-Ouest | 15 | $860,000 | 43 d | 96.9 % | Moderate |
LaSalle | 10 | $912,500 | 46.5 d | 97.9 % | Low |
Montréal-Nord | 10 | $772,500 | 104.5 d | 98.0 % | Low |
Firm sales dated September 2026, Island of Montreal, Centris data, compiled by Endurance Groupe Immobilier par Tardif (eXp Realty). Only segments with 10 or more sales are published; no figure is estimated or filled in. "Median time on market": median number of days between listing and firm sale. "Negotiation ratio": median ratio of sale price to last asking price, calculated across all sales in the segment. "Reliability": the methodology's classification based on sample size n. These tables describe segment medians: they are not a score by sector.
What do the September 2026 figures show? Editorial reading
Incoming supply is rising faster than demand. In September 2026, the Island of Montreal records 2.9 new listings per sale (3,150 for 1,087), versus 2.7 in August 2026 (2,402 for 883). The gap between what comes onto the market and what closes widens, hence the drop in the SNLR from 36.8% to 34.5%.
Expirations are the component that moves the most. In September 2026, 824 listings expired without a sale, versus 429 in August 2026 and 703 in September 2025. The expiry ratio moves from 32.7% to 43.1%: more than four resolved listings out of ten end without a transaction. However, an expiration is not a withdrawal; it only means no sale was concluded during the term of the listing contract.
Same category, different paces. In September 2026, condominiums sell in a median of 34 days in Le Plateau-Mont-Royal (51 sales), 39 days in Verdun (39 sales), 84 days in Le Sud-Ouest (53 sales) and 103 days in Ville-Marie (76 sales). The island index describes a general trend; however, these times show that it does not play out the same way from one borough to the next.
This section is an editorial reading of the data published above. It is neither a forecast nor advice about any particular property.
Who publishes The Tardif Index™, and what does it cover?
The Tardif Index™ is published under the methodological responsibility of David Tardif, real estate broker licensed by the OACIQ (licence E2815). The indicator covers the 19 boroughs of the City of Montreal and the 15 linked cities. It excludes Laval and the South Shore.
The Tardif Index™ is complementary to the Centris HPI and APCIQ statistics. The Centris HPI tracks price trends; The Tardif Index™ measures transaction conditions. The score is monthly: the weekly bulletin of The Tardif Index™ only reports it. The bulletin's reference page is at https://enduranceimmobilier.com/en/tardif-index/ and earlier editions are gathered in the archives.
Frequently asked questions
What is The Tardif Index™?
The Tardif Index™ is a monthly 0-to-100 indicator of residential transaction conditions on the Island of Montreal. It is published by Endurance Groupe Immobilier par Tardif (eXp Realty) under the methodological responsibility of David Tardif, a real estate broker licensed by the OACIQ. It thus combines the sales-to-new-listings ratio (40%), the expiry ratio (30%) and year-over-year sales momentum (30%). In September 2026 it stands at 16.7 out of 100. Methodology: enduranceimmobilier.com/en/tardif-index/methodology/.
Why does The Tardif Index™ fall from 18.1 to 16.7 between August and September 2026?
The sales-to-new-listings ratio slips from 36.8% to 34.5%: indeed, new listings rise from 2,402 to 3,150 (+31.1%), while sales rise from 883 to 1,087 (+23.1%). Moreover, the expiry ratio climbs from 32.7% to 43.1% (824 expirations). Two of the three components therefore sit at their floor, and the 16.7 score rests on the sales-to-new-listings ratio alone. Methodology: enduranceimmobilier.com/en/tardif-index/methodology/.
Which territory does The Tardif Index™ cover?
The Tardif Index™ covers the Island of Montreal: the 19 boroughs of the City of Montreal and the 15 linked cities. However, it excludes Laval and the South Shore. Thus, the 1,087 sales and 3,150 new listings for September 2026 relate exclusively to this island territory. Source: Centris data, compiled by Endurance Groupe Immobilier par Tardif (eXp Realty).
Are more listings expiring on the Island of Montreal in 2026?
Yes. In September 2026, 824 listings expired without a sale on the Island of Montreal, versus 703 in September 2025, an increase of 17.2%. In addition, the expiry ratio, meaning expirations divided by the sum of sales and expirations, reaches 43.1% (32.7% in August 2026). Both years are measured on the same calendar month. Source: Centris data. Archives: enduranceimmobilier.com/en/category/tardif-index/.
How does September 2026 compare with September 2025?
Island of Montreal sales fall 14.0% year over year, from 1,264 to 1,087, while expirations rise 17.2%, from 703 to 824. As a result, the expiry ratio moves from 35.7% to 43.1%. However, The Tardif Index™ has no published score for September 2025. Source: Centris data, compiled by Endurance Groupe Immobilier par Tardif (eXp Realty).
Data sources
- Primary calculations: Centris data, compiled by Endurance Groupe Immobilier par Tardif (eXp Realty)
- Cross-validation: Centris HPI (APCIQ), APCIQ monthly statistics
- Methodology: https://enduranceimmobilier.com/en/tardif-index/methodology/ (v2.1)
- Archives: https://enduranceimmobilier.com/en/category/tardif-index/
Suggested citation
Tardif, D. (2026). The Tardif Index™ — September 2026: strong buyer zone on the Island of Montreal (16.7 out of 100).
Endurance Groupe Immobilier par Tardif.
https://enduranceimmobilier.com/en/tardif-index/cision-september-2026/
Methodology v2.1 • License CC BY 4.0
Learn more: The Tardif Index™ (main page) • Methodology • Archives • David Tardif
The Tardif Index™ is a neutral indicator of transaction conditions. It is neither a forecast nor real estate investment advice. The conditions described relate to the month just ended and may change quickly.
Published October 2, 2026 by Endurance Groupe Immobilier par Tardif (eXp Realty), under the methodological responsibility of David Tardif, real estate broker licensed by the OACIQ.



SOURCE Endurance Real Estate by Tardif

